What is the best moment to do an aerial inspection? Does it matter whether it’s a sunny day or not? What ambient factors should you take into account?
This blog will give you more insights into the weather factors for a successful thermal inspection, allowing you to track data over time and at multiple sites, resulting in more accurate and comparable results.
Ambient factors to consider when doing a thermal inspection
You will not perform an aerial thermal inspection when it is raining heavily. But what other ambient factors should you take into account?
In essence, a thermal inspection is measuring infrared light. This infrared light indicates the temperature of an object. In the case of scanning solar panels with a thermal camera, you will need temperature differences to detect defects. Irradiance, expressed in Watts per square meter (W/m²), comes from the sun and causes solar panels to heat up. Since irradiance induces electricity generation in solar panels, it thus also makes it possible to distinguish solar cells that are not working correctly. Therefore, irradiance is considered the most crucial ambient factor during a thermal inspection. In the case of solar plants, it is more specifically the Global Tilted Irradiance (GTI), the total radiation collected on the tilted surface of the solar panels.
Other ambient factors influencing the solar panel scans include air temperature, module temperature, wind speed, and wind direction. These will impact the results from a thermal inspection, making it worthwhile to consider them when analyzing the results.
Ideal irradiance level for a successful thermal inspection
During an aerial thermal inspection, the IEC Standard requires a minimum GTI of 600 W/m². This means that, during the entire flight, the GTI should not drop below this value to be IEC compliant. At Sitemark, we see that you can detect most anomalies with at least 400 W/m². However, going below 400 W/m² makes detecting inadequate or non-functioning cells in the solar panels harder.
Ways to obtain irradiance levels during an inspection
Verifying the irradiance levels when doing a thermal flight inspection is vital. But how do you do that? How can you confirm that you performed the inspection under the right conditions, e.g., when you have outsourced the inspection to a pilot? Looking at the sky and checking whether the sun is shining is a good start, but having exact values to rely on is better. There are three ways of ascertaining irradiance levels, each with a different level of accuracy.
Satellite data
This is the first and easiest way to verify that irradiance levels are adequate during an inspection. The advantage of using satellite data is that you don’t require extra equipment during the inspection and can check the data after the inspection.
A disadvantage of using only satellite data to verify the inspection conditions is the risk of a lower accuracy level as the irradiance is not measured on the panel. You need to know the panels’ geometry, orientation, and tilt to calculate the Global Tilted Irradiance (GTI) accurately. This information is unfortunately not always readily available. However, it can be a good check if you can’t do on-site measurements.
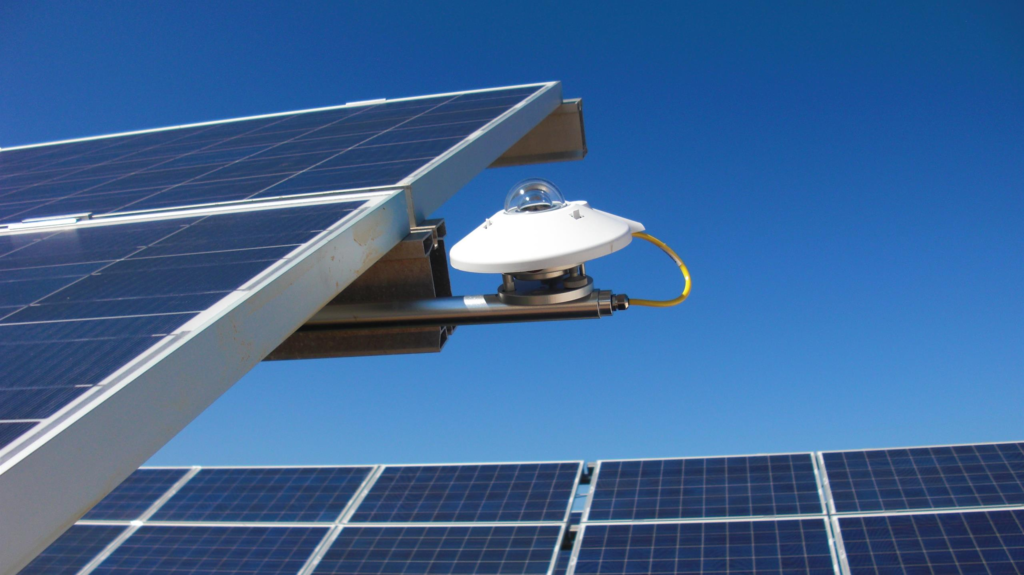
Pyranometer on site
You can use the second option if the inspected solar plant has a specific instrument to measure irradiance: a pyranometer. This pyranometer logs the irradiation on the solar plant at precise timestamps. When the flight times of the thermal inspections are known, you can extract the data afterward.
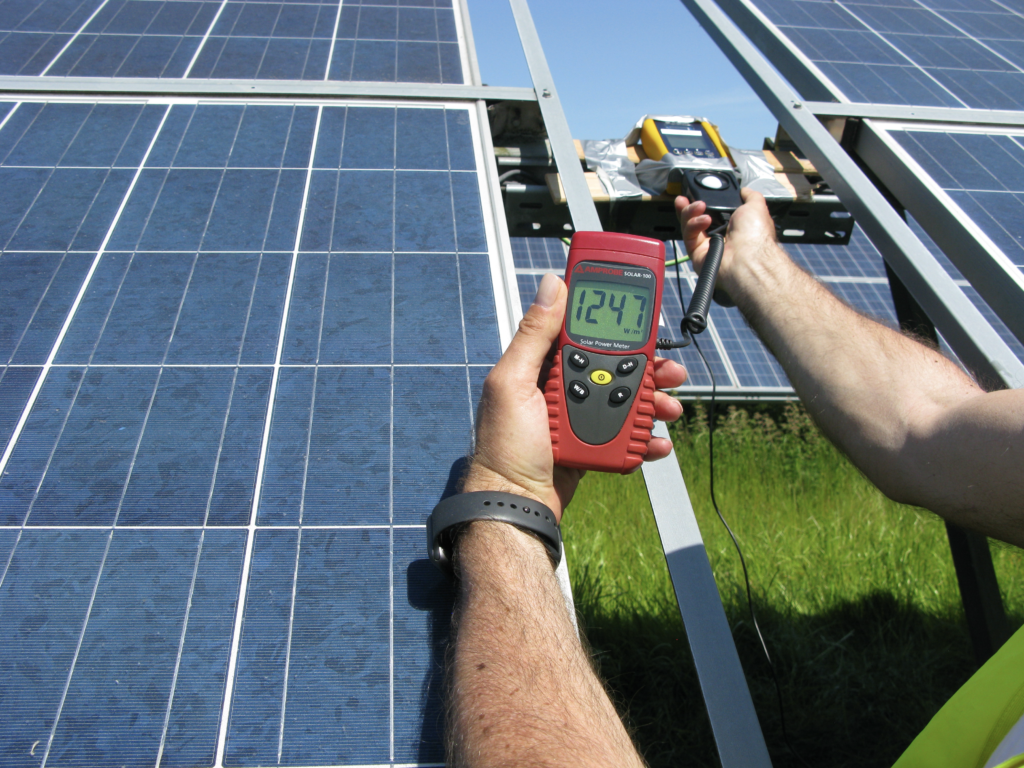
Handheld pyranometer
The third and most accurate solution requires a pilot with extra equipment: a handheld pyranometer. To have representative measurements, the pilot should measure the irradiance levels at least every 15 minutes. The advantage of a handheld device vs. a pyranometer on site is that the measurement location should always match the area you are scanning. To have accurate readings, the pilot should ensure he calibrates his device before each flight. Check out this article on using a handheld pyranometer.
Use of the irradiance data
Having all your thermal inspection irradiance data is good, but what’s next?
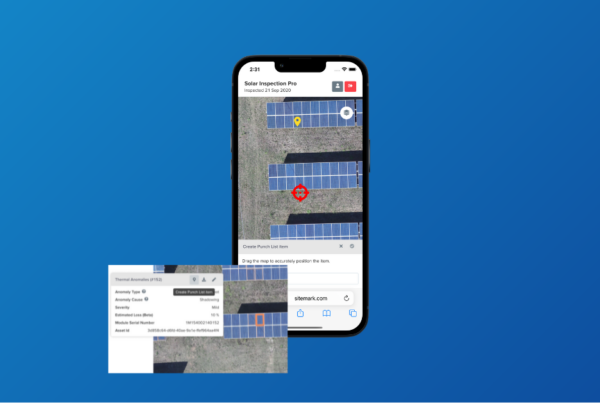
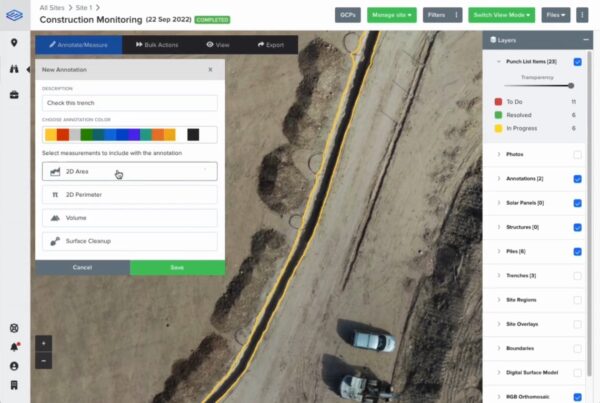
You could check whether the irradiance is sufficient during the entire inspection by manually checking that all data points exceed the threshold limit. However, a more manageable approach would be to upload your data onto the Sitemark Fuse platform. After the inspection, you can upload irradiance data from either a handheld or on-site pyranometer. Uploading satellite data onto the Sitemark Fuse platform is unnecessary as we integrate with the satellite data service SolarGIS.
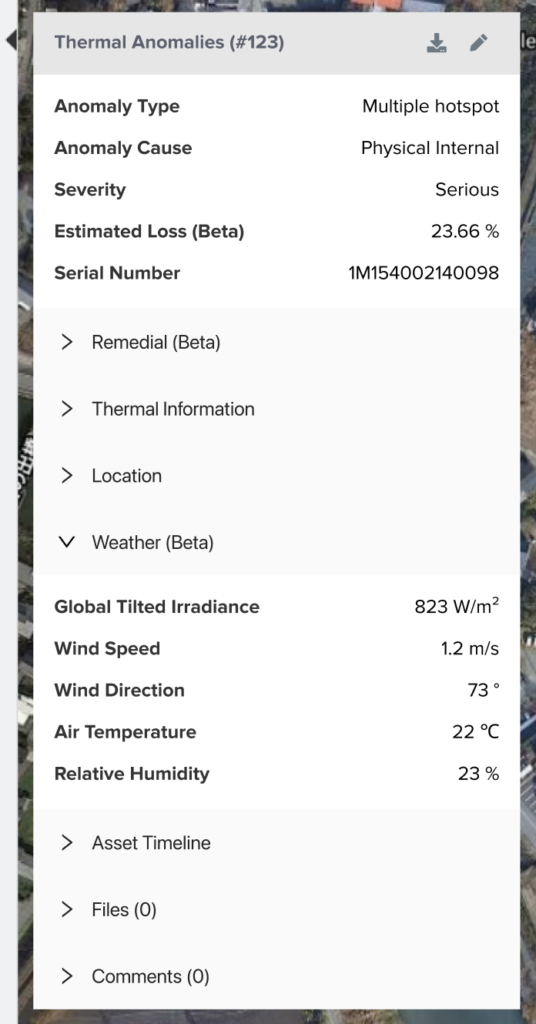
The upload is also not limited to irradiance data only; it allows you to upload different weather factors (wind, air temperature, wind speed, wind direction, etc.), linking them to the anomalies on the site.
By uploading weather data for the timestamp you scanned the anomaly, it gets included in that anomaly.
Ok, cool, but what is the added value?
One benefit is knowing that you performed your inspection with the minimum required amount of irradiance and detected the anomalies correctly. But the most important benefit is to be able to draw the correct conclusions. This is where temperature normalization comes in.
The temperature differences will also increase when the irradiance level increases during an inspection. Without temperature normalization, it might seem like detected hotspots are more severe on a day with high irradiance. That means that once you start comparing the severity of hotspots to other operations (on the same site or different ones), it becomes hard to draw correct conclusions (i.e., the anomaly got worse, anomalies on this site are less severe than on other sites, etc.).
Temperature normalization, however, allows you to compare results more accurately.
Once the irradiance level is known for every anomaly, you can normalize the delta temperatures of the hotspots to make it easier to compare them across scans. The anomaly’s delta temperature will be normalized to a reference level of 1000 W/m², using linear interpolation based on the irradiance, as indicated by the IEC standard:
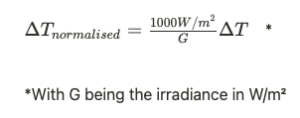
The IEC standard for solar cells states this formula. At Sitemark, we use it for extended area abnormalities because most anomalies we detect are larger than a couple of square millimeters. Still, we also refer to this standard for smaller surfaces to look more in-depth.
Another benefit of having irradiance data is when making warranty claims. The irradiance data available makes a case for a warranty claim much more substantial. The customer can show he performed the thermal inspection with the best possible quality and according to all the standards.
Conclusion
The weather conditions when doing thermal inspections on your site are fundamental. We highlight this importance by allowing all customers to bring their weather data to the Sitemark Fuse Platform. We even offer inspections with a guaranteed irradiance level, including proof.
It is comforting to know that you inspected according to IEC standards, detected all anomalies correctly, and that will be able to make more substantial warranty claims – if need be.
It also enables accurate comparisons between inspections giving the customer more power to make the right decisions.
Do you want to find out more? Check out our webinar, hosted together with Solargis, or get in touch.