Intro
The solar industry is a rapidly growing field generating clean and renewable energy. Solar power has seen significant growth in recent years due to the increasing demand for sustainable energy sources.
A critical aspect of maintaining a solar power system is regular inspections to guarantee a stable output. This is crucial to ensure that the system operates at optimal levels and produces the maximum energy possible.
In 2022 we at Sitemark analyzed solar sites in over 50 countries.
And this is what we discovered.
Let’s take a look!

The total number of anomalies we found caused a loss of 812,6 GWh.
This can be compared to electricity lost for 232,000 families per year.
Thermal Anomalies
Thermal anomalies are abnormal temperature patterns that can occur in solar panels, causing a decrease in their efficiency and output. Various factors, such as dust, debris buildup, and equipment malfunction, can cause these anomalies.
Another common cause of thermal anomalies is shadowing, which can occur when nearby trees or buildings cast shadows on the solar panels. Shadowing reduces the amount of sunlight that reaches the panels, decreasing their efficiency and output. Through thermal imaging, you can detect thermal anomalies in solar panels. Once an anomaly has been detected, the cause can be identified, and appropriate action can be taken to solve the issue.
In 2022, we discovered 1,112,904 modules affected by various anomalies significantly impacting the output.
The Top 3 Anomalies
1. (MULT) HOTSPOTS – 602,980 MODULES
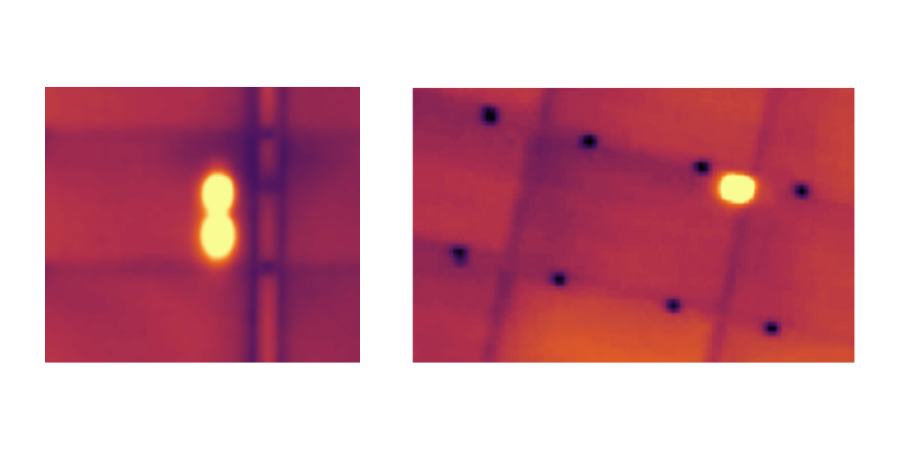
Hot Spots indicate a defect at the cell level, in which one or several cells have a higher temperature than the neighboring ones.
Overheated cells acting as a resistor will dissipate the energy generated by the other cells. Such cells will have an impact on the production of the entire string of that PV module.
Keep in mind that one Hot Spot on a string is capable of causing a power production loss of up to 90% of the nominal production of one PV module.
2. STRING ISSUES – 314,060 MODULES
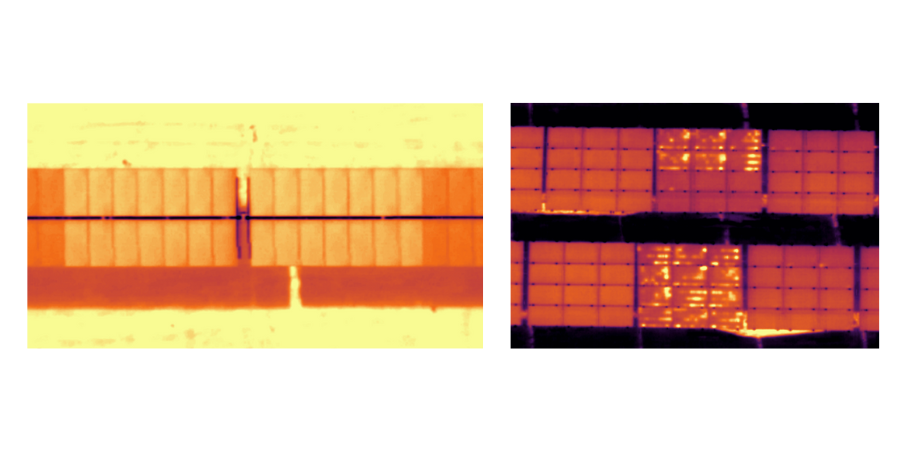
There are three types of string anomalies.
Open Circuit String: One group of PV modules is warmer than another comparable group of PV modules by a few degrees, but the temperature is uniform across the impacted group
Short Circuit String: We see a patchwork pattern on one group of panels. This is usually on the whole string.
Inverter Blackout: An inverter blackout looks precisely the same as an open circuit string in thermal, but all strings of that inverter are out. If you have a string plan showing where the inverters are laid out, you can determine a string outage vs. an inverter outage.
When an entire string of PV modules is disconnected, these PV modules are not producing any power. This means the power loss is 100% for as long as the string issue exists.
3. PID ISSUES – 69,954 MODULES
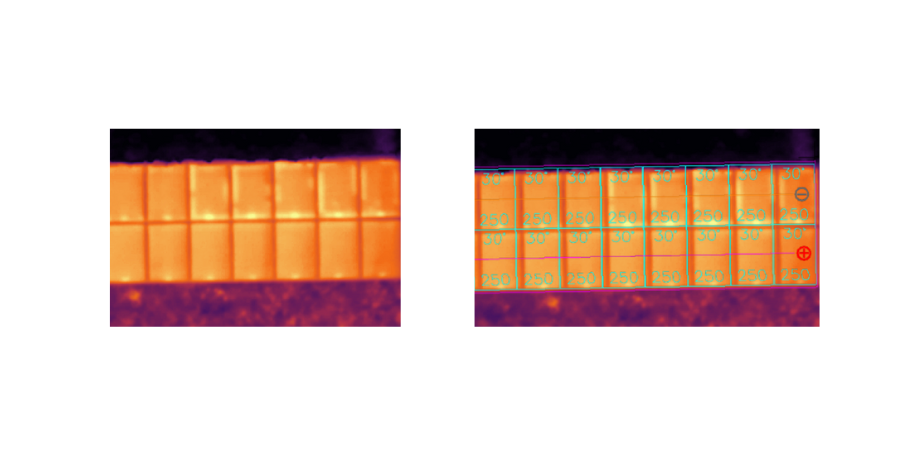
PV modules show a pattern of hotspots starting from the edges, and this pattern starts from the negative pole of the string and goes a few modules to the positive pole.
A commonly accepted estimate in the scientific community is that power losses per PV module impacted may be as high as 30%. PID issues tend to get worse over time.
Does this make you wonder how your site is doing?