Why PV Thermography Results Depend on Context
PV thermography enables fast, scalable anomaly detection—but only when done right. Learn how weather, methodology, and frequency determine reliable results.
PV thermography is one of the most widely used diagnostic tools in solar operations and maintenance. Drone-based inspections make it fast and scalable to detect anomalies across large portfolios. However, thermography does not automatically produce reliable decisions.
Image quality, interpretation accuracy, inspection methodology, and timing all determine whether thermography identifies real performance risks. Understanding these factors is essential for asset owners and O&M teams seeking actionable results.
How Weather Conditions Affect PV Thermography Results
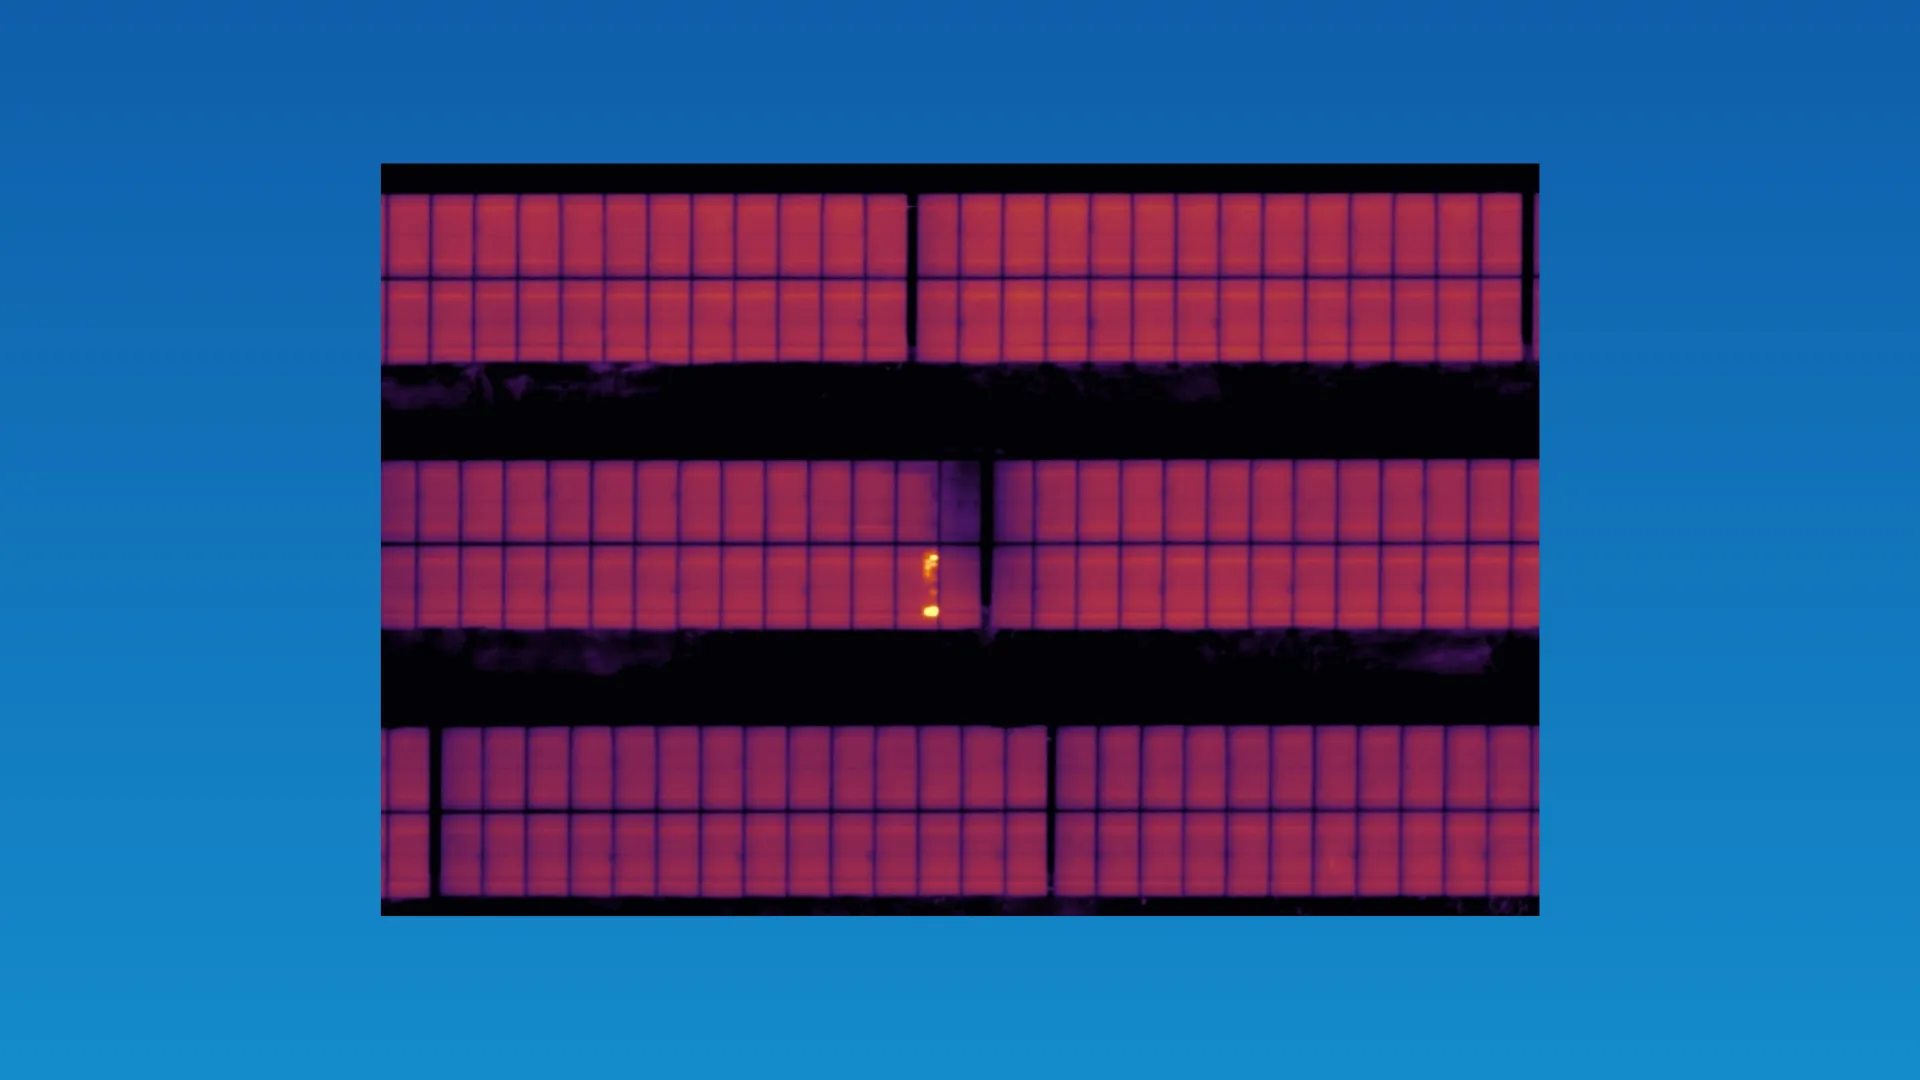
PV thermography identifies potential defects based on temperature differences. Weather conditions directly influence thermal contrast and interpretability.
Key Weather Factors in Solar Thermography
- Irradiance: Reliable inspections generally require ≥600 W/m². Below this threshold, thermal contrast decreases and anomalies become harder to distinguish.
- Wind: High or gusty wind cools modules unevenly, masking true hotspots or creating artificial gradients.
- Ambient temperature: Extreme heat compresses temperature differences; cold conditions can exaggerate minor effects.
- Cloud movement: Passing clouds introduce transient thermal patterns that resemble electrical faults.
- Recent weather history: Rain can temporarily suppress soiling effects; rapid heating after cold nights can exaggerate benign anomalies.
Common Causes of False Thermal Positives in Solar Inspections
Not every detected hotspot represents a failure. Many anomalies might be false thermal positives caused by external or temporary conditions.
Typical Sources of False Positives
- Soiling patterns: Dust, pollen, or bird droppings causing localized heating
- Vegetation shading: Temporary shading that disappears after trimming
- Angle-of-incidence effects: Tracker tilt, row edges, or array geometry
- Reflections and emissivity errors: Frames, mounting hardware, or incorrect camera settings
- Low-irradiance inspections: Insufficient thermal excitation amplifying noise
Why this matters:
Misclassifying false positives leads to unnecessary field interventions and inflated O&M costs. Detection must be paired with root-cause analysis.
Radiometric vs. Non-Radiometric PV Thermography Inspections
Inspection methodology determines how thermography data can be used.
Radiometric PV Thermography
- Captures temperature values per pixel
- Enables ΔT measurement and severity classification
- Required for IEC-compliant inspections
- Supports warranty claims, insurance use, and trend analysis
- Enables loss estimation and prioritization
Non-Radiometric PV Thermography
- Provides relative thermal imagery only
- Useful for qualitative screening
- Cannot reliably quantify severity or compare inspections over time
- Limited value for financial or contractual decisions
Rule of thumb:
If thermography results are used for prioritization, audits, or financial impact estimation, radiometric inspections are essential.
Recommended Thermography Inspection Frequency for Solar Assets
There is no universal inspection schedule. Frequency should be driven by risk, asset age, and value exposure.
Typical Inspection Frequency Guidelines
- Utility-scale solar portfolios:
- Annual thermography as a baseline; biannual for high-value or high-risk assets
- Newly commissioned plants:
- Inspection within 6–12 months to identify installation defects
- Aging solar assets (7–10+ years):
- Increased frequency due to higher degradation and failure rates
- Event-driven inspections:
- After extreme weather, curtailment changes, or unexplained performance drops
Key principle:
Risk-based inspection planning delivers more value than fixed schedules.
Conclusion: How to Get Reliable Value from PV Thermography
PV thermography is a powerful diagnostic tool, but only when applied with context.
Weather conditions influence detectability. False positives inflate noise. Inspection methodology defines what conclusions are defensible. Inspection frequency determines whether issues are caught early or late.
When these factors are ignored, thermography becomes a reporting exercise. When they are managed deliberately, it becomes a decision-support tool that protects performance, reduces risk, and preserves solar asset value.
The difference lies not in flying drones more often—but in understanding what the data truly means.