
We often get the question: Which Ground Sampling Distance (GSD) would suit my inspection?
The answer to that question depends on the expected outcome or use of the results of your inspection. While all inspection jobs require an accurate GSD calculation, the specifics of the tasks will impact which GSD to select.
As always, there’s a tradeoff between quality and cost. A higher resolution inspection grants more insight but can drastically increase data acquisition and processing times. You thus want to find the sweet spot that delivers the insights you need at an affordable price.
Let’s start with the beginning!
What is Ground Sampling Distance exactly?
GSD stands for Ground Sample Distance. In simple terms, it’s the resolution of the scan. It measures the real-life space occupied by each photograph pixel and is thus typically expressed in cm/pixel.
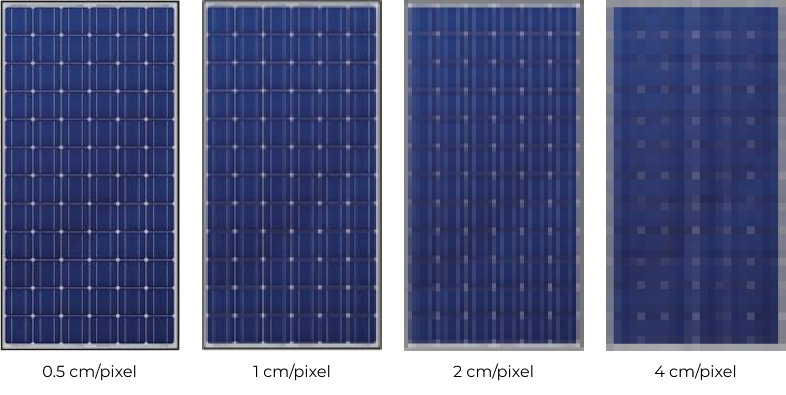
Let’s look at the example below to make this more tangible.
It shows the same module at different GSDs. The lower the GSD, the higher the resolution of the imagery. You can still notice the fine lines between the cells pretty on the 1 and 2 cm/pixel images, even though such a line is only a few millimeters thick.
A lower resolution essentially blurs the image. You quickly lose less apparent details, like small spots with a different shade of blue, but not apparent features, like a white line between blue cells. Something similar happens in thermal, where you can easily spot high delta hotspots at higher GSDs but can miss subtle problems like PID.
Ground Sample Distance was coined for geographical scans (hence the “ground” part) but continues to be used for other types of remote sensing, e.g., imagery acquired from the sky with drones, planes, or satellites. It’s essential always to consider what the target surface is, though. For example, if you want to scan solar panels on a roof, you should look at more than just ground-level resolution.
On what does Ground Sampling Distance depend?
The GSD depends on several things, most notably the camera specifications (resolution and lens characteristics) and the distance between the camera and the target, e.g., the flight altitude. Let’s look at the defining parameters separately.
If we look at the camera, the most important factors are the resolution and the lens characteristics. A higher resolution camera will yield a higher resolution scan. That makes sense, right? However, the lens’s impact is a bit trickier to understand, so we won’t go into the details here. There are tons of interesting articles out there that explain how it works.
What matters for us is that the lens determines the field of view. A wider field of view means you capture a larger area, reducing the scan’s resolution. Better lenses cause less distortion in the imagery, which improves the resolution.
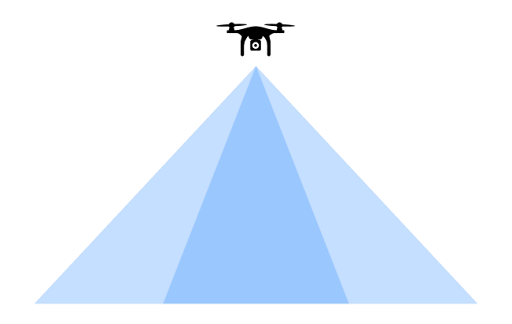
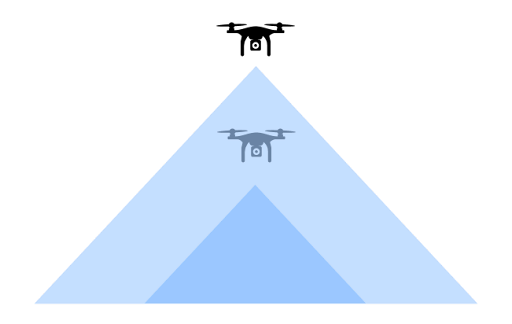
The final impact is the distance between the target and the camera, mainly determined by the flight altitude. Flying higher again allows you to cover a wider area but reduces the resolution of the scan.
Does the Ground Sampling Distance impact the acquisition & processing time?
It most certainly does! Flying at a better GSD increases the amount of data and, thus, the time needed to acquire and process it, which will reflect in the cost.
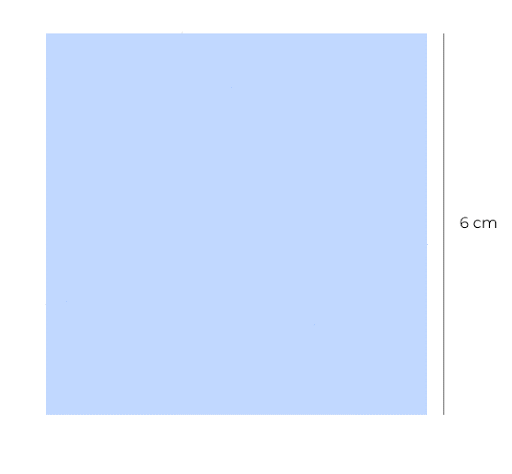
A good rule of thumb is that if you halve the GSD (double the resolution), the cost will be multiplied by four. Splitting the physical size of a pixel creates four times more pixels. You thus have to capture and process four times more data. The image below makes this intuition clear.
Let’s look at an example:
Flying a 15ha field (equivalent to ±10 MW of PV panels) at 3 cm GSD would take 88 minutes using the latest equipment (M300 & H20T) vs. 23 minutes at 6 cm GSD.
If you are flying many sites or larger projects, this increase in flight time will have a commercial impact. It is, therefore, essential to ensure that you are using your or the pilot’s resources time efficiently.
The same applies to the data processing time: more data will take longer to process.
It is crucial to balance your needs with the commercial budget of the project.
What GSD do I need?
As mentioned above, determining the GSD you need depends on what you want to get out of your inspection. We can divide use cases into two sets: detection and analysis.
In a detection use case, you want to detect something without further analyzing it. A good example is a solar construction scan used to report the number of installed modules.
In an analysis use case, however, you need more detail as the goal is to analyze what you have adequately detected. Think about an accurate loss estimation for a hotspot found in a thermal scan.
The smallest element you want to detect or analyze defines what GSD you need. Let’s look at what this means for different types of inspections.
Choosing the right GSD isn’t always straightforward. Too low, and you're drowning in data. Too high, and you risk missing critical details.
If you're unsure whether you're using the optimal GSD for your inspections, our team is happy to help.
Book a meeting with us and let’s find the right balance between accuracy, efficiency, and cost for your projects.

Thermal Inspection
The goal of a thermal inspection can range from a quick high-level scan to detect severe problems on the string or inverter level to a detailed analysis of sub-cell level issues to prioritize maintenance actions or facilitate warranty claims.
The following table shows which granularity of problems you can detect or analyze at common thermal GSDs. It’s important to know that most thermal inspections rely on visual imagery to help identify the cause of the issues. Since the visual causes can be much smaller than the defect itself (like a bird dropping causing an overheated cell), we recommend using a visual GSD 3 to 4 times smaller than the thermal GSD to classify the anomalies correctly.
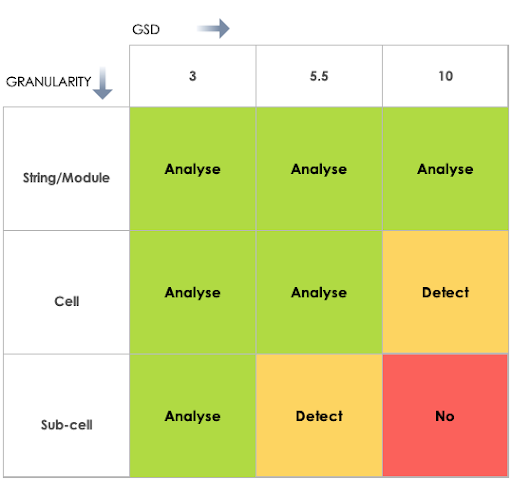
Let’s look at these common GSDs and their use cases.
A 10 cm thermal GSD is great for quickly checking the most impactful issues, such as inverter or string outages, open panels, or bypassed substrings. You should still be able to detect critical cell-level defects, like high delta hotspots, but the temperature measurements can’t be trusted for prioritization because of the blurring effect. They’ll tend to be underestimated, so you should reduce your threshold for investigating them.
A 5.5 cm thermal GSD is what most customers find the sweet spot. It accurately analyzes cell-level defects while detecting sub-cell-level issues. As it’s hard to accurately predict the impact of sub-cell level issues from a thermal scan alone and the cost of a 3 cm scan can be up to 4 times higher, the benefits don’t outweigh the costs.
A 3 cm thermal GSD is mainly used by research-minded customers who want accurate insights into all defects. It’s also recommended by IEC standard 62446-3 and thus can be required by some module manufacturers for warranty claims. Because you have a high resolution, absolute temperature measurements of minor defects will be more accurate, making comparing detections across sites and through time easier. Unfortunately, acquisition and processing costs are much higher, so it’s only worth it if you know how to get the most out of these insights.
It’s worth noting that the numbers above are based on standard cell sizes. Split cells or thin-film modules might require a higher resolution to analyze them properly.
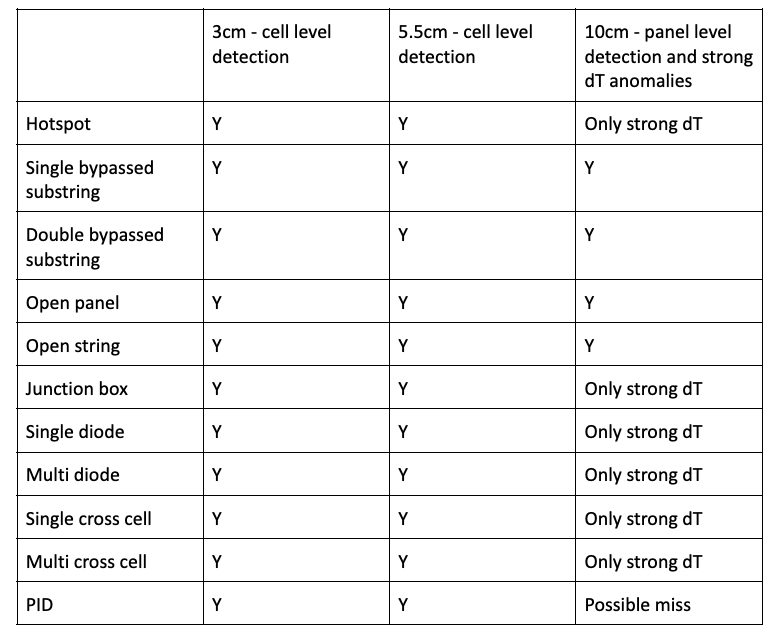
As we highlighted at the beginning of this article, reducing the resolution essentially blurs the image. In the thermal analysis, minor high delta anomalies are still detectable at higher GSDs, while more subtle defects can be missed. The following table gives an overview of what you can reliably detect at the different GSDs.
Solar Construction Monitoring
Solar construction scans are more straightforward as they only work with visual imagery.
When we think about the detection use case, we’re typically looking at following up on mechanical works, e.g., installing piles, structures, and modules. The smallest element here is usually a pile. A scan of around 2 cm GSD is recommended for this use case.
There are two analysis use cases we can define for the solar construction stage: quality analysis and earthworks analysis. A GSD of 1 to 2 cm is usually sufficient for these use cases, assuming you use a high-accuracy positioning system like RTK or ground control points (GCPs).
Topography
A topography scan aims to generate an accurate 3D model of the site to design and optimize your solar plant properly.
We’d recommend a GSD of 1 to 2 cm for image-based topographies. Rough topographies of up to 5 cm GSD already improve over satellite-based models but typically don’t allow for filtering out vegetation properly. It’s also possible to work with Lidar-based acquisition, as it makes it easier to filter out vegetation.
Final Thoughts
Choosing the correct GSD is not always an easy task. Higher-resolution scans reveal more details, enabling a better and more trustworthy analysis. Unfortunately, increasing the resolution rapidly drives up costs. Doubling the resolution typically increases the cost fourfold. If you’re unsure what’s best for your use case, try the middle ground first. It’ll reveal a lot of information already at an affordable price.