At Sitemark, we have flown tens of thousands of drone flights which have given us robust insight in how to capture the highest quality images in the least amount of time. In this blog, we share some of these informed insights, especially useful for solar inspections.
• Large sites benefit from flight blocks
• Flight timing hacks
• Photo overlap hints
1) Flight blocks
The issue with flying large solar sites is the varying irradiance throughout the flight. When flying missions that are bigger than 5 hectares, it’s important to split the site into blocks of 5 hectares or less. Cutting the mission into these smaller blocks helps ensure that weather conditions are kept homogeneous within each block, improving the ability to accurately compare temperature measurements.
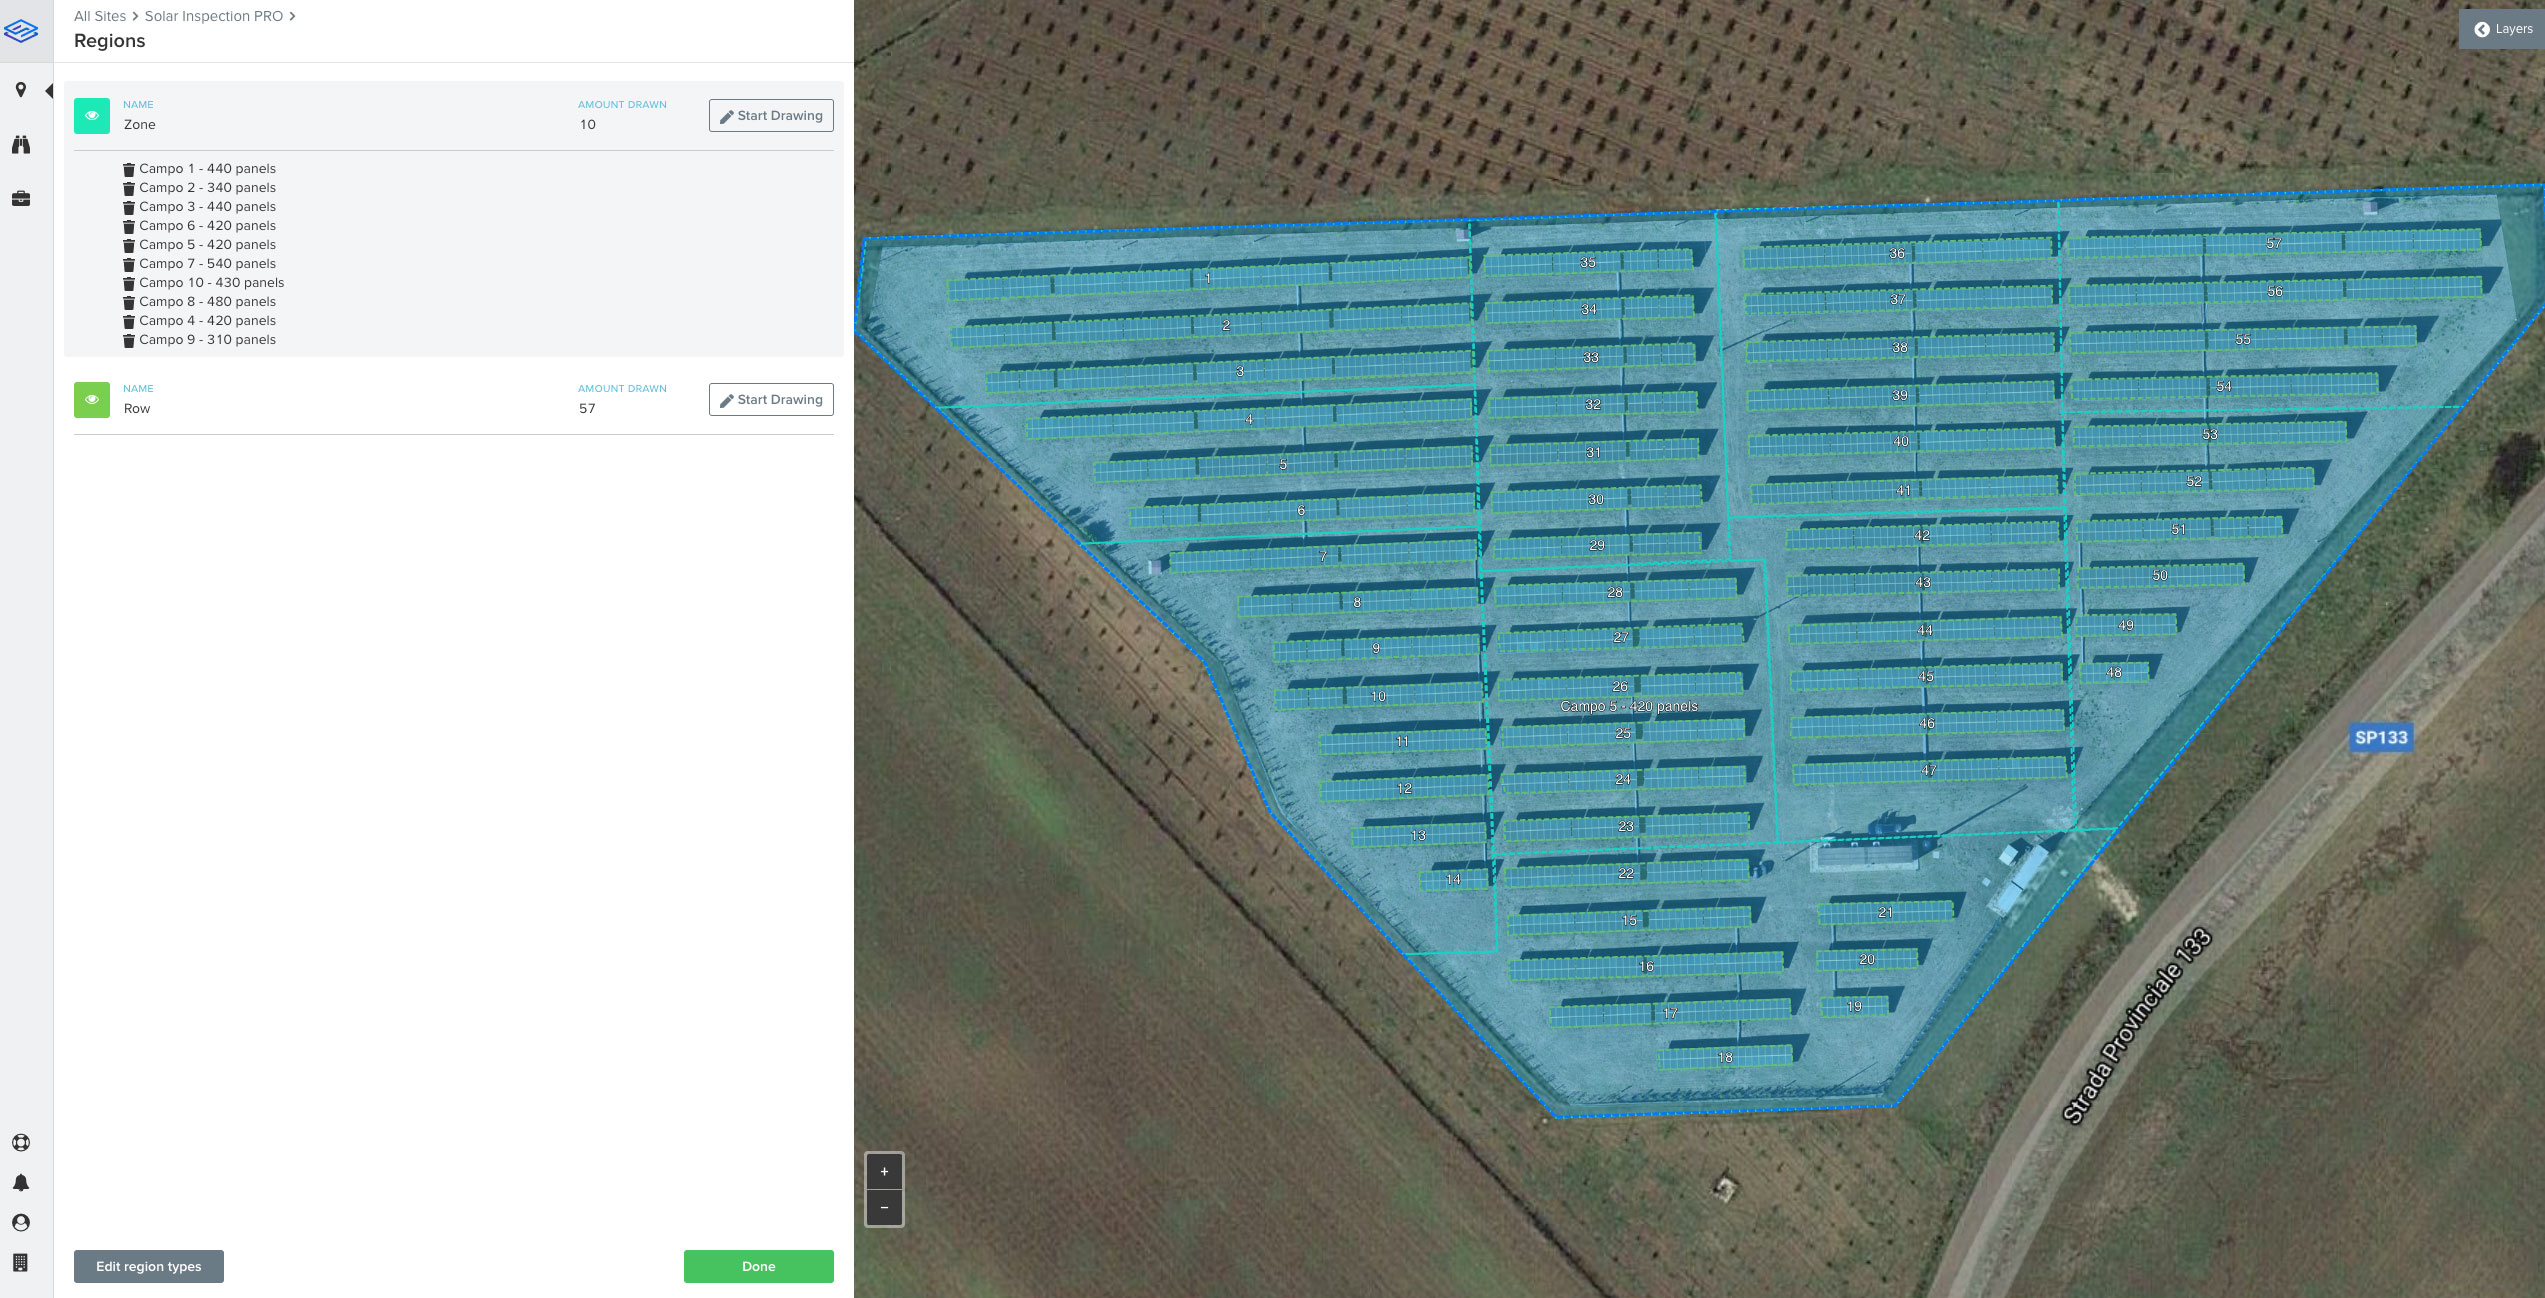
When splitting the blocks, it’s useful to look for logical places to cut the block (i.e. not in the middle of a string) as this will help to reliably stitch the data afterwards. Make sure the maximum height difference doesn’t exceed 10 meters at any point of the block. To help with this, once you have created the block choose a take-off location that is at the average height of the block. Instead of a difference of +/- 10m, you will be spreading the difference across the block. This will help maintain a constant GSD (ground sampling distance) within the block, improving output quality as well as the ability to stitch the blocks together when image processing has been completed.
2) Timing
When dealing with drone thermography, irradiance supersedes all other variables, meaning timing is everything. Therefore, we share here some of the most important timings to get right when looking at drone thermography, especially when inspecting solar panels.
• Thermal flights: Make sure as much as possible to have full blocks flown in one mission. This will reduce the fluctuations in weather conditions and help achieve consistent irradiance levels, which can cause data quality issues. While there may be weather variances from block to block, what’s important in thermography is comparing apples to apples.
• RGB & Thermal: If you are performing separate flights for RGB and Thermal, it is crucial to minimise the time between flights. If this is not the case, what may have been displaying as a thermal anomaly on the thermal flight might not be present on the RGB flight (i.e. shadow analysis).
• Time of day: It goes without saying that the time of day will drastically affect the output results of a solar inspection. Waiting until late morning or early afternoon when the sun reaches its highest point will maximise the direct radiation to the panels and make any anomalies very clear. While this might seem counterintuitive, if instead you wait until the sun is directly over the panels you may incur solar reflections and subsequently, potential data inaccuracies. Fortunately, Sitemark has developed algorithms which locate and flags images with these signatures.
3) Overlap
Due to the lower resolution of the special thermal cameras and generic homogeneity of the panels, creating thermal orthomosaics can be almost impossible without sufficient overlap. Two examples of where it’s very easy to get the picture overlap wrong are when dealing with rooftop inspections or at the edges of the site being inspected.
While creating your flight plan for a rooftop inspection might seem straightforward, getting it right will take some proper planning and calculation. The simplest way to start planning would be to design the flight at ground level with all the correct parameters and then add the height of the building onto the flight height. However, image overlap must be calculated at ground level. This means increasing the flight height to take into account the building, which will push the drone flight outwards from its original ground position to maintain the original overlap settings. While the overlap on the ground might be at the correct setting, the overlap of the roof (which is the desired contact point) will be too low.
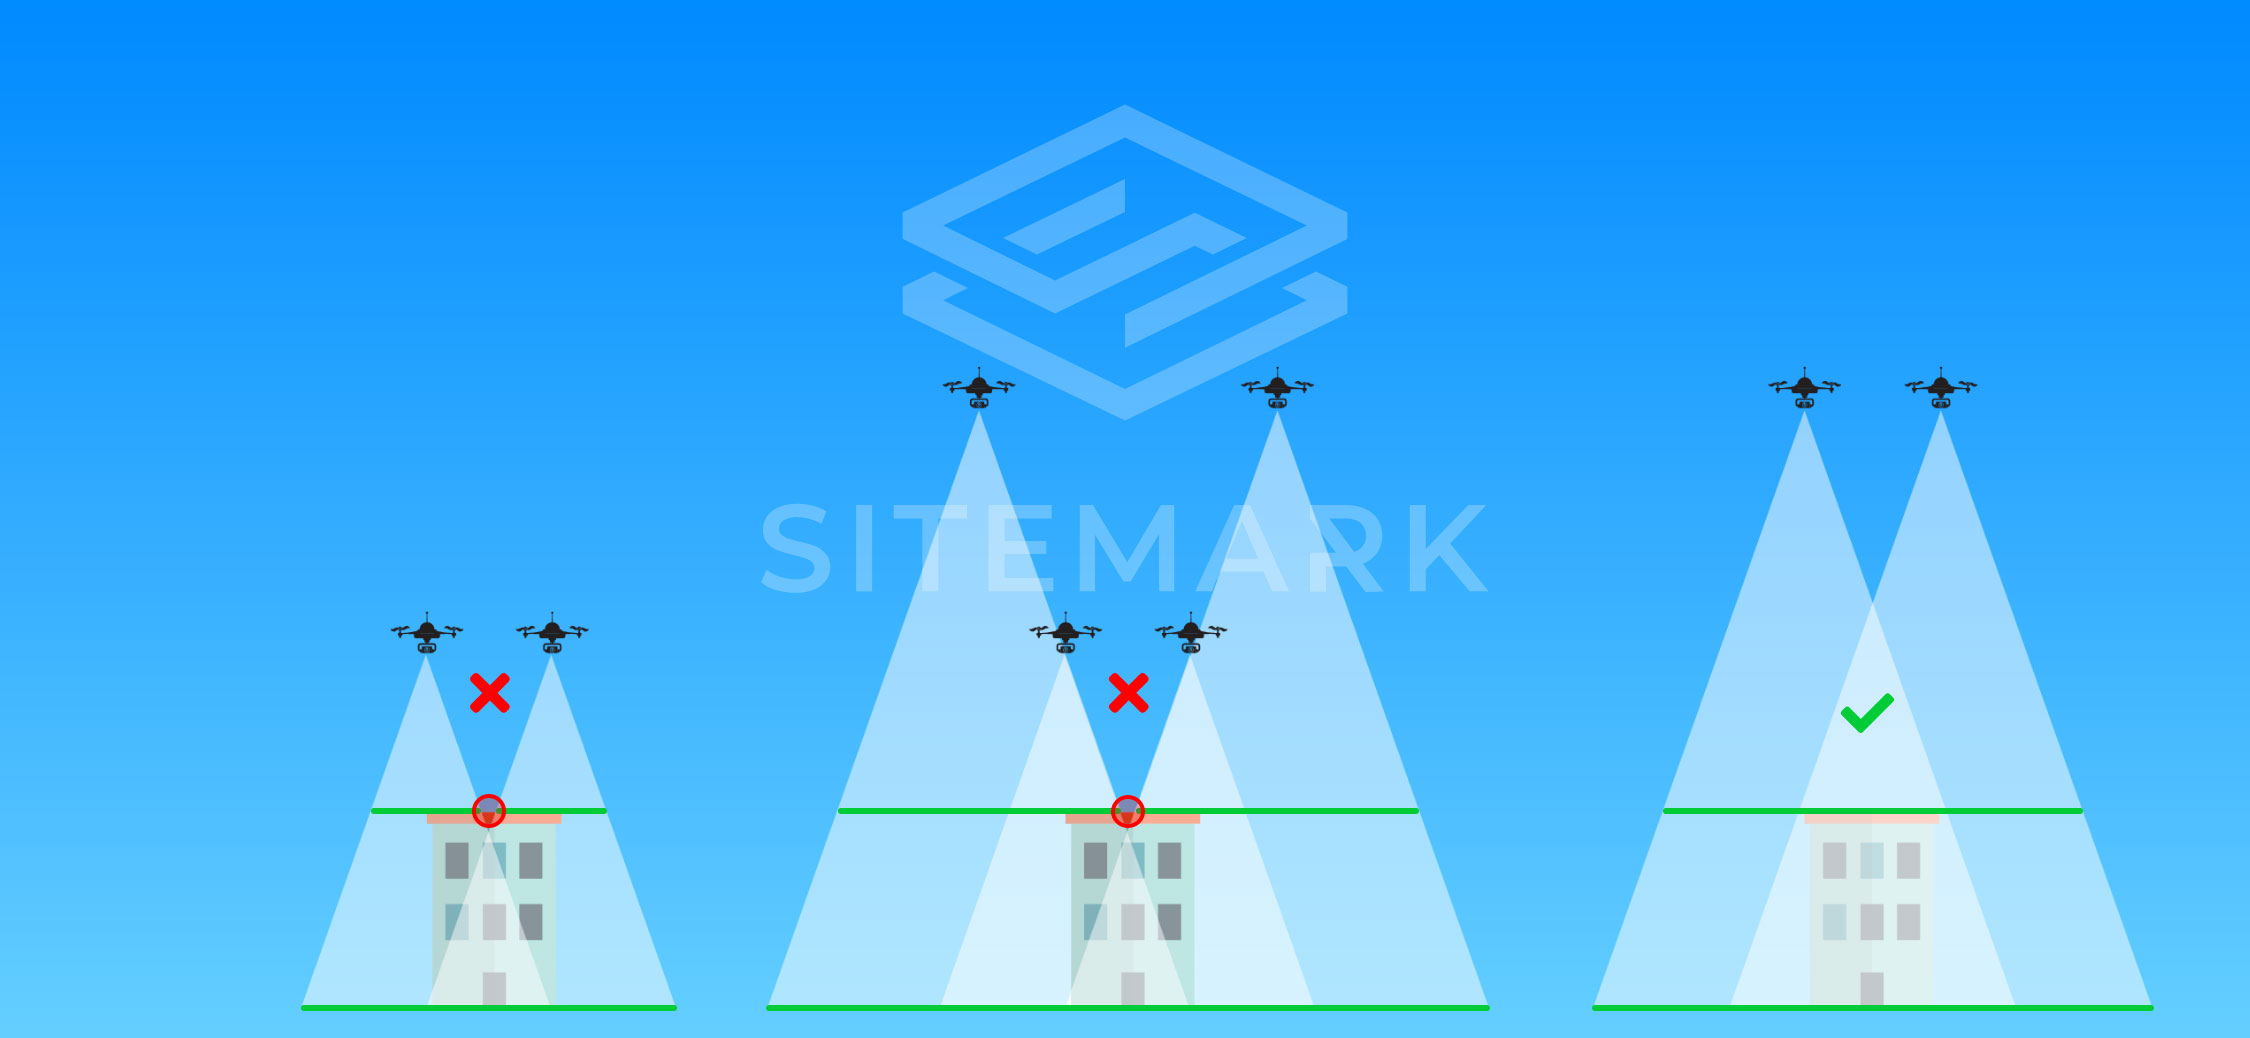
There are two ways to resolve this, the simplest is to take-off from the roof, but this isn’t always possible. If you’re not able to access the roof we have a workaround. Start by planning your flight from ground level with the correct parameters for the flight and record the flight time of the mission. Then, increase the flight height by adding in the highest point of the roof. You can then increase the front and side overlap equally until you have reached the same flight time as the original flight at ground level. The flight time is a direct result of the number of photos that are taken, more photos equals longer flight time. Seeing as more photos equals more overlap, matching the flight time will give us the desired overlap of photos.
The next thing that can go wrong when trying to have sufficient overlap of an inspection is at the boundaries of the site. If you’ve ever wondered why the edges of your orthomosaic haven’t stitched well, it’s most likely an overlap problem. The issue is that photo overlap is calculated as an average value of a picture. Side overlap is increased by reducing the width of the flight line; however, they only start and end one line within the selected boundary. This means that for flight lines at the lateral edges of the boundaries, the photos won’t have the longer flight line outside of the boundary to ensure the necessary overlap.
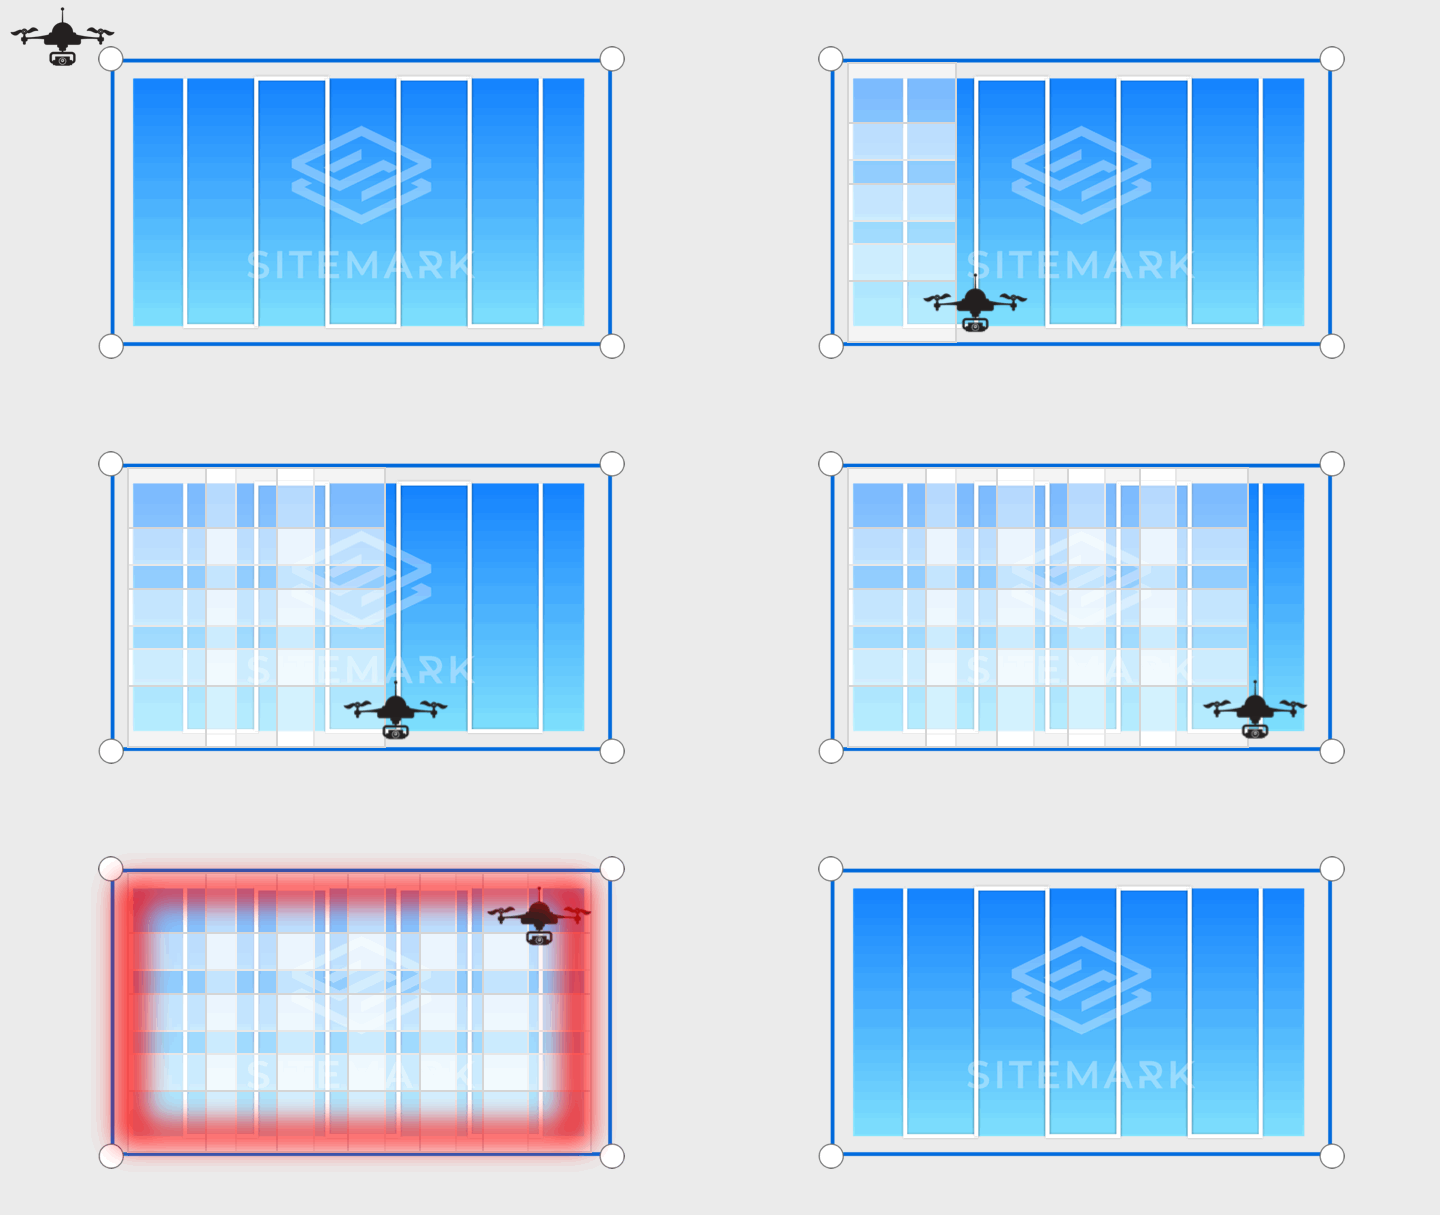
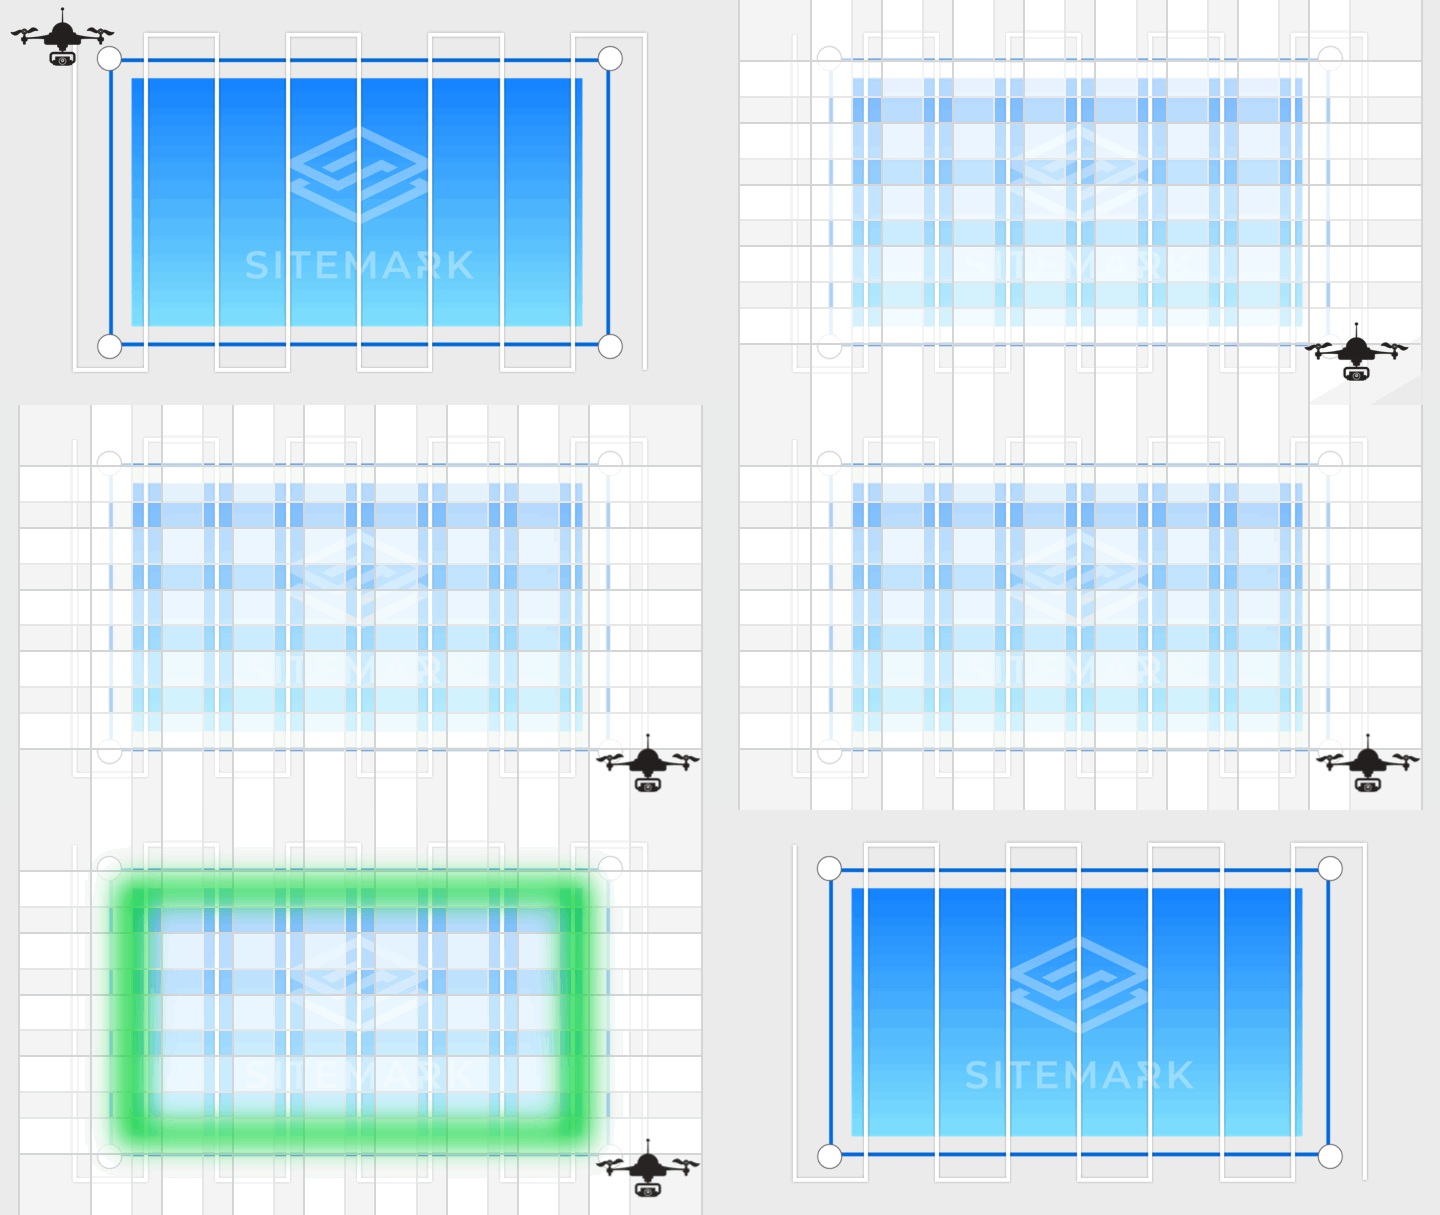
To prevent this overlap problem and insure there is sufficient coverage for the whole site with the most consistency, adjust the margin of your flight lines. To guarantee coverage of the site, we would recommend two full flight lines outside the boundaries of the site as shown in the image below.
Thanks for reading and let us know if you have any suggestions on aerial data intelligence topics you would like to learn more about.

