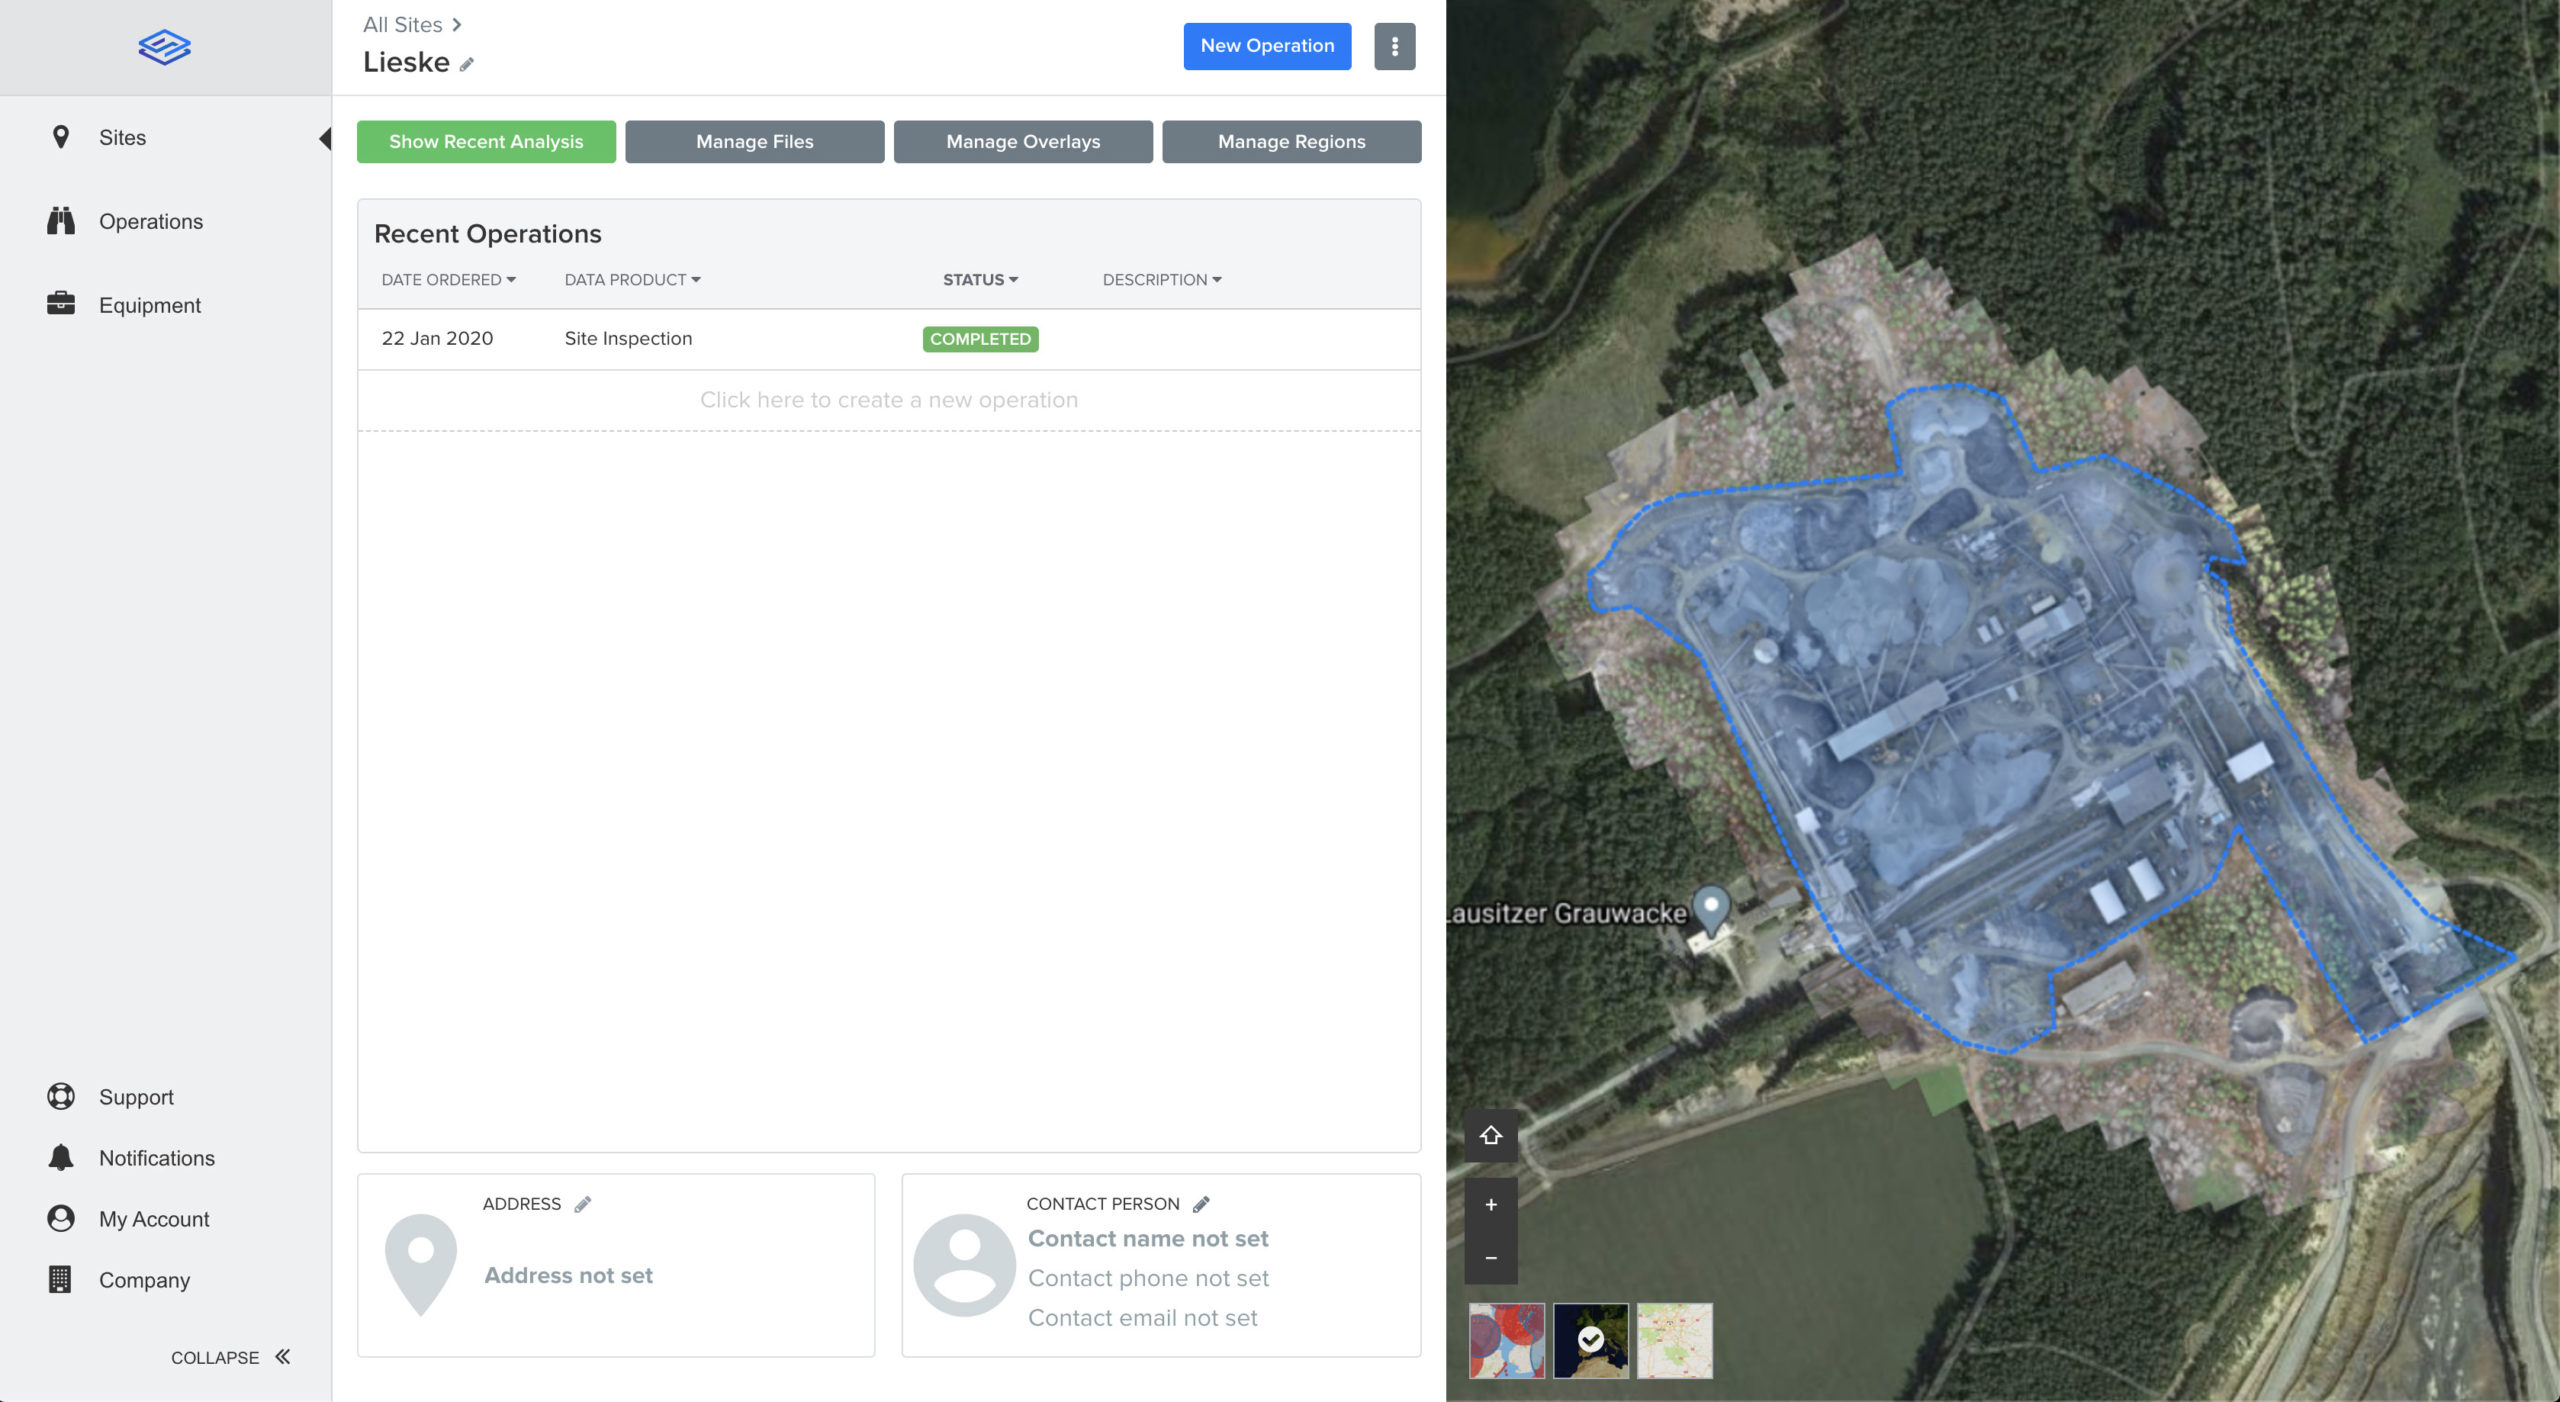
Technology is paving the way for the digitalization of the Construction industry. Several aerial data analytic features are now available, ideal for Surveyors and Project Managers. This blog shares how these new Sitemark platform capabilities can make your job easier and your site more efficient.
DXF Overlays
As a Surveyor or Construction stakeholder, you need to be able to upload DXF plans and surfaces to verify, compare and build on them. The DXF file format by AutoCAD is one of the most popular file formats used within the construction industry.
DXF overlay compatibility
DXF import allows users to upload their CAD drawings from any of their CAD softwares to the system. The Sitemark platform produces an RGB visual representation of the site. You can add DXF files as an overlay of a site and the file will be visible on both the 2D and 3D viewers. Once the DXF has been added as an overlay, it is then possible to select this layer for base surface of volume calculations.
DXF base layer
Additionally users can use this layer in their volume measurements and calculations by using it to define the base layer for that measurement. The user can do this by drawing the boundaries of their measurement and then selecting their DXF layer.
Advanced Volume Measurements
As a Surveyor, it is critical to be able to view a cut fill map of a volume measurement to visually see the elevation differences and assess terrain changes. A cut fill map is a common requirement for any earthworks project, color-coded to represent the series of depth range.
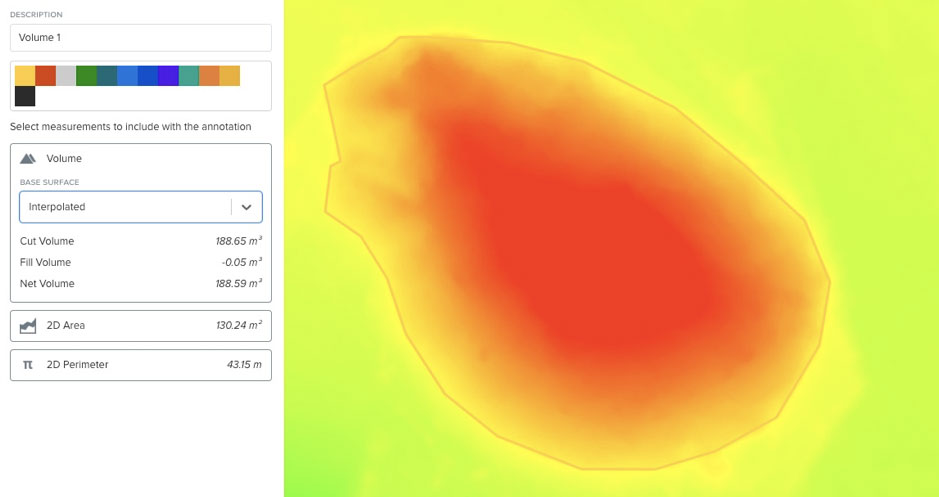
This advanced volume measurement tool allows users to calculate the cut, fill and net volumes in 2D and 3D. You also have the choice of different base surface types such as interpolated, flat minimum, flat maximum and flat custom. These select options are also available in the exported Excel document. This function works for all types of volume measurements, including base surfaces such as DXF. You can also adjust the color visualization range (min and max together as one), and still filter out the small noise using a slider. All new functionality delivers more sophisticated ways to measure in 3D for increased accuracy by better defining volume.
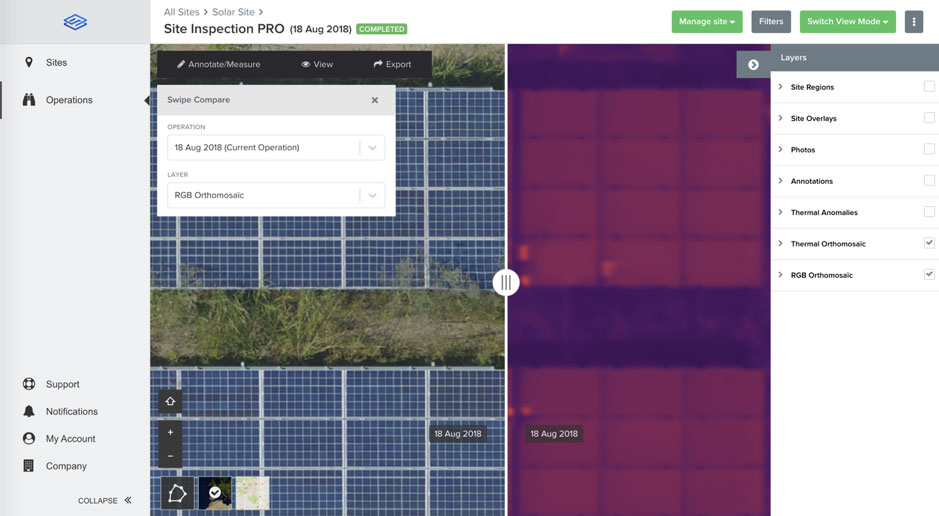
Visual Swipe & Compare
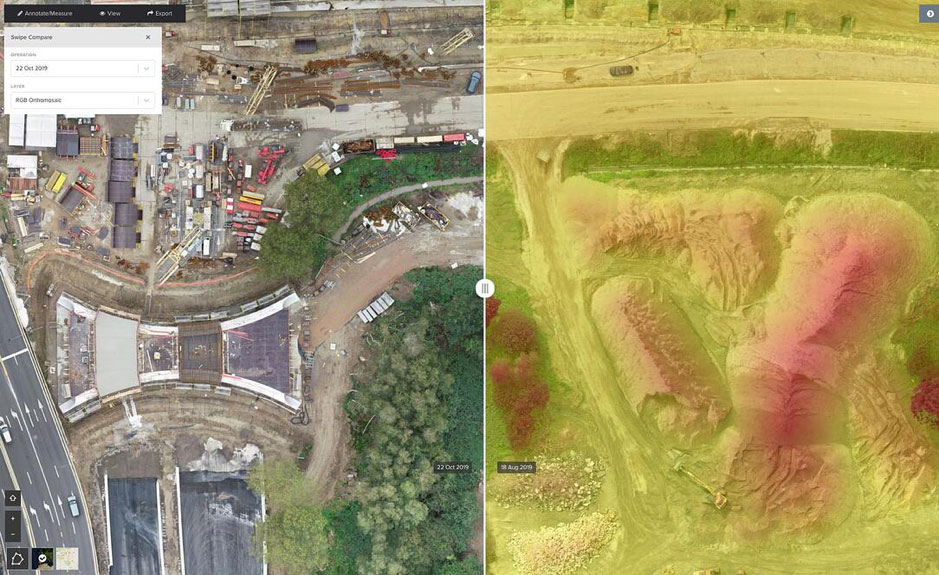
The visual swipe compare enhancements allow users to compare between two completed operations of the same site side-by-side. This is valuable in determining how site changes evolve over time. This ability to visually manage site progress is very useful for Project Managers in both the Construction and Solar industries.
The visual swipe compare can be used in any completed operation to not only visually compare different layers of the same operation, but also different operations of the same site.
Use cases:
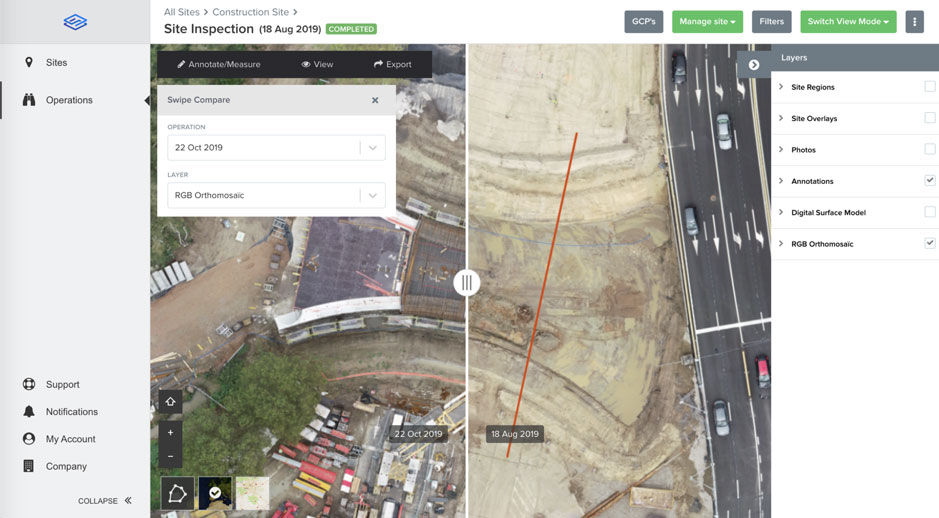
1. Tracking progress in a construction site: By comparing the RGB layers from two different operations, you can compare the progress that has been made. Alternatively, you can also compare digital surface model layers to give further insights into site progress.
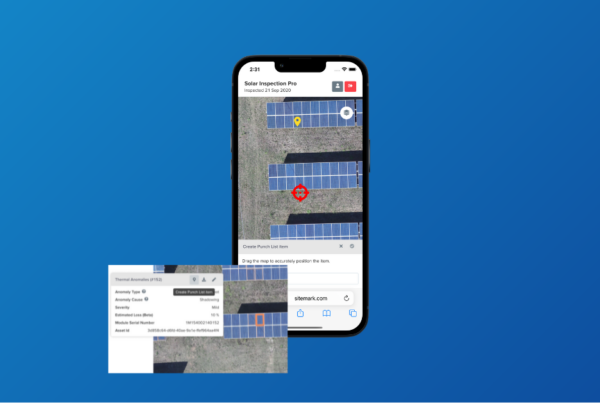
2. Verifying corrective actions had the desired impact: By comparing the thermal layers of two separate operations, you can verify that corrective actions solved the issue or if the issue persists. This can be particularly useful in solar construction to insure that soiling or vegetation issues have not caused permanent damage to the solar panels.
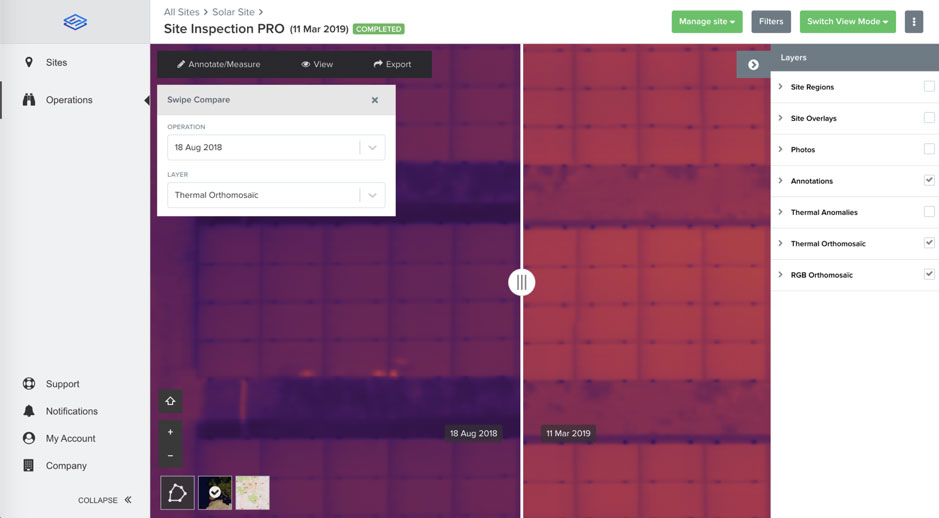
3. Performing cause detection on heat signatures identified within an operation: By comparing the thermal and the RGB layer you can get an indication of what might be causing the heat signature. This can help target specific issues and develop targeted maintenance strategies, such as to identify heat leaking from a roof.
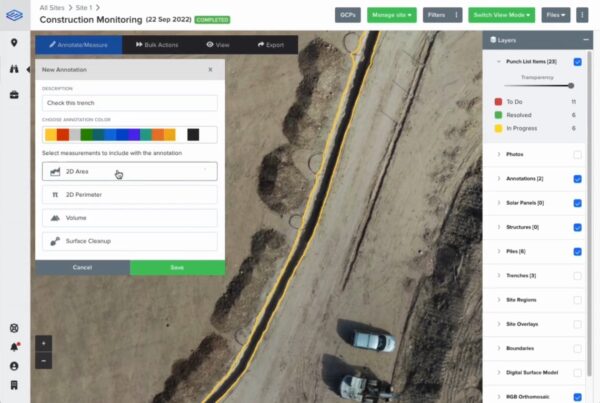
3D Annotations
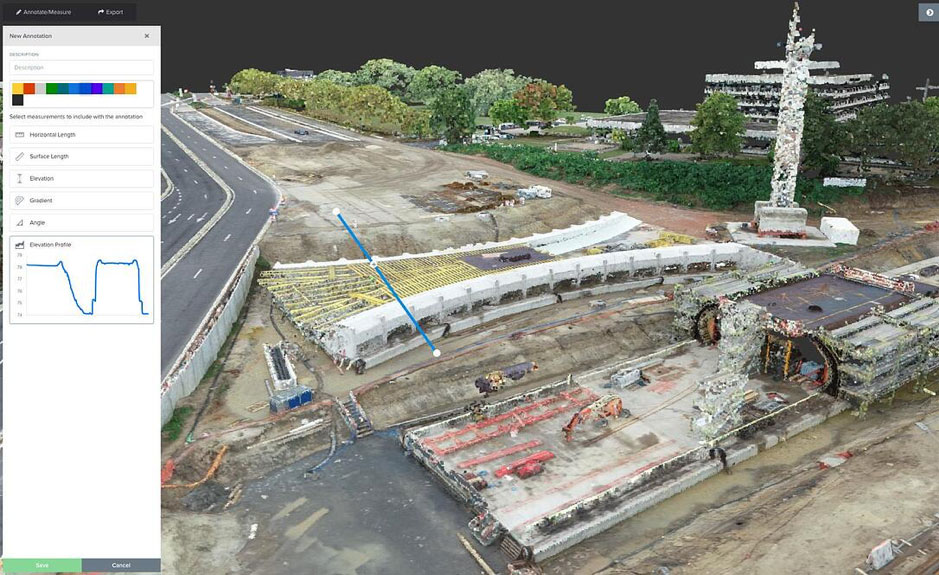
Ideal for Surveyors and Project Managers in the Construction industry, users now have the ability to annotate and measure in the 3D viewer, taking your measurements to the next level. You can draw lines, polygons and points on the point cloud/3D model of a completed operation. By drawing in the point cloud, the user can even do vertical measurements (i.e. measuring the length of a vertical structure). The annotations are synced between both 2D and 3D. By making measurements also in the 3D viewer it is clearer what is being measured on complex terrains, compared to a flat 2D view. Being able to create the annotations is the first step to being able to interact with them to perform measurements and export them.
Drone images, in conjunction with the Sitemark Fuse platform, supports your digitalization demands. Advances in drones, analytics and cloud-based solutions are paving the way for the design of a digital construction site. Sitemark provides a world-leading aerial data platform already being deployed by industry leaders for applications such as ground surveying, construction progress monitoring, asset inspection and general mapping.